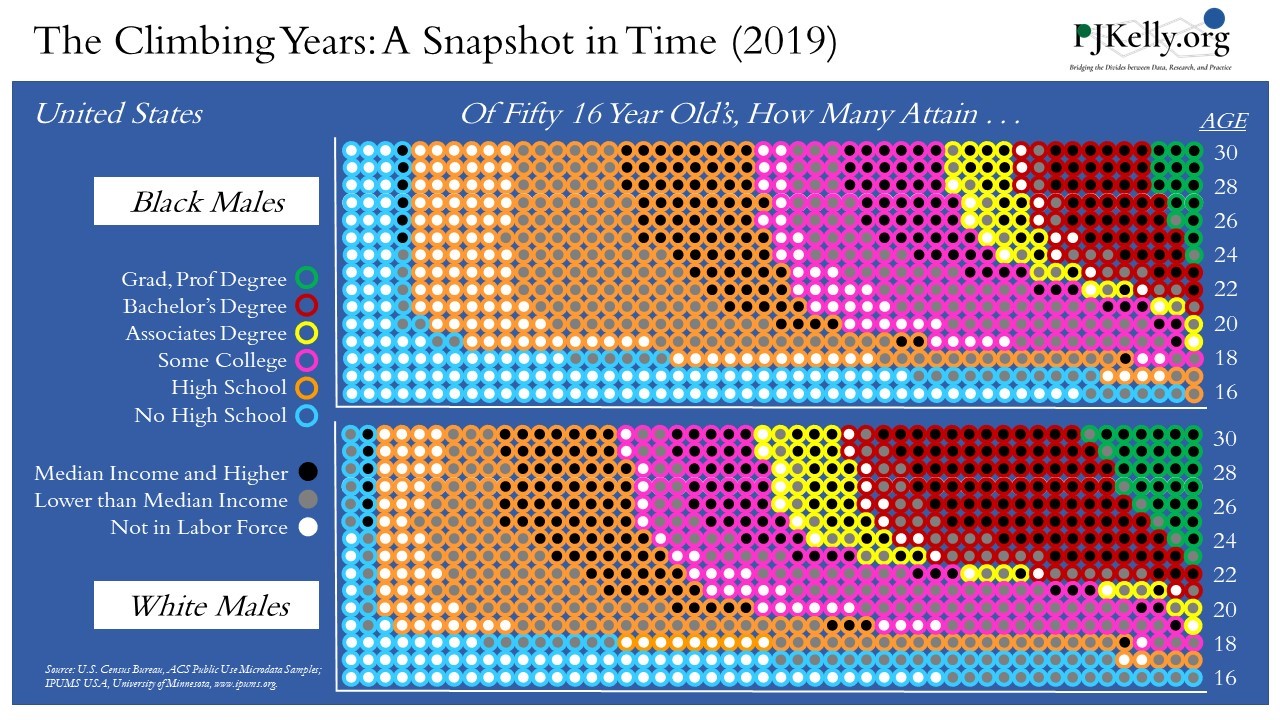
With so much needed attention given to racial and ethnic inequities in the U.S., the graphs show the general education and workforce status of Black and While males at each age from 16 to 30 years old. While it begs a lot more research questions, it is a start in understanding where the racial/ethnic gaps in educational attainment and workforce participation begin to occur and grow throughout the late teens and 20s. These data can be disaggregated in a variety of ways – e.g. by state, race/ethnicity, gender, and occupational status.
Infographic #1 – The Climbing Years: A Snapshot in Time (2019)
April 27, 2021

